“Atmospheric pressure data collection”的版本间的差异
(Created page with "{{Language | 大气压数据采集}} {| style="width: 800px;" |- | ==Objective== This tutorial will use the BM180 air pressure sensor on Microduino-10DOF module and the data w...") |
(没有差异)
|
2014年5月22日 (四) 12:48的最新版本
| Language | English |
|---|
ObjectiveThis tutorial will use the BM180 air pressure sensor on Microduino-10DOF module and the data will display in Processing. Equipment
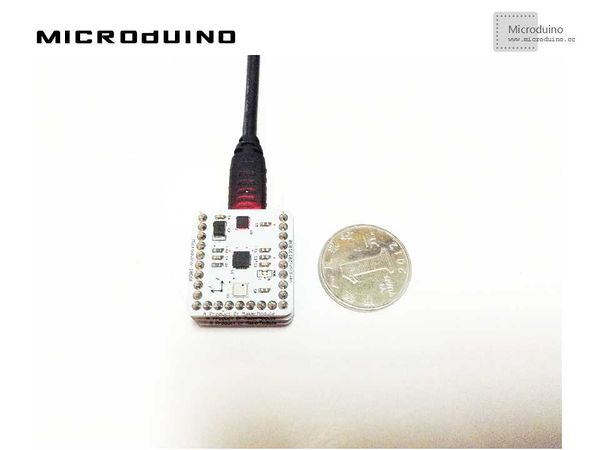
SchematicUse the Microduino-10DOF module's BMP180 sensor directly. ProgramRefers to AtmosphericDataCollection processingBMP180 DebugStep 1:Set up hardware system, as follows: Step 2: Explain the code: This example needs two parts code, one is Processing and the other is Microduino. Microduino: //Get the air pressure data for Processing's display. void vobmp085()
{
// request pressure (3x oversampling mode, high detail, 23.5ms delay)
barometer.setControl(BMP085_MODE_PRESSURE_3);
while (micros() - lastMicros < barometer.getMeasureDelayMicroseconds());
// read calibrated pressure value in Pascals (Pa)
pressure = barometer.getPressure();
Serial.println(pressure/1000,3);
delay(100);
}
Processing: //Get the first seria data // is always my Microduino, so I open Serial.list()[0].
// Open whatever port is the one you're using.
myPort = new Serial(this, Serial.list()[0], 9600);
myPort.bufferUntil('\n'); // Trigger a SerialEvent on new line
//Display the data that Microduino received in screen and mark the table scale. void draw() {
background(255);
// Draw lines connecting all points
for (int i = 0; i < vals.length-1; i++) {
stroke(0);
strokeWeight(1);
line(i, vals[i], i+1, vals[i+1]);
}
// Slide everything down in the array
for (int i = 0; i < vals.length-1; i++) {
vals[i] = vals[i+1];
}
String val = myPort.readStringUntil('\n');
if (val != null) {
val = trim(val);
println(val);
pressure=Float.parseFloat(val);
}
vals[vals.length-1] = 200-pressure;
//Display scale
text ( "200-", 370, 10);
text ( "--", 370, 50);
text ( "100-", 370, 100);
text ( "--", 370, 150);
text ( "0-", 370, 200);
//show current num
text ( pressure+" Kpa", 0, 10);
}
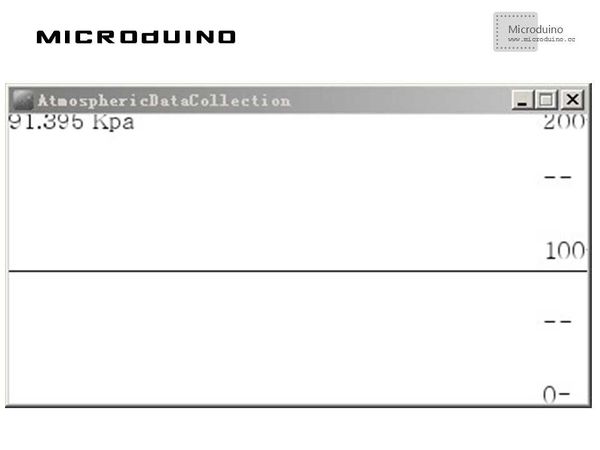
Step 3: Compile the code and download it. Step 4: After running, observe the curve on Processing. ResultScreen will display the air pressure data curve, as follows: Video |

