“光照强度数据采集”的版本间的差异
(→程序) |
(→程序) |
||
| (未显示2个用户的2个中间版本) | |||
| 第7行: | 第7行: | ||
==设备== | ==设备== | ||
| − | *'''[[Microduino-Core]]''' | + | *'''[[Microduino-Core/zh]]''' |
| − | *'''[[Microduino- | + | *'''[[Microduino-USBTTL/zh]]''' |
| − | *'''[[Microduino- | + | *'''[[Microduino-Weather/zh]]''' |
*其他硬件设备 | *其他硬件设备 | ||
| 第22行: | 第22行: | ||
==程序== | ==程序== | ||
| − | + | [https://github.com/Microduino/Microduino_Tutorials/tree/master/Microduino_Processing/LightDataCollection LightDataCollection] | |
| − | LightDataCollectionArduino | + | [https://github.com/Microduino/Microduino_Tutorials/tree/master/Microduino_Processing/LightDataCollectionArduino LightDataCollectionArduino] |
==调试== | ==调试== | ||
2014年10月29日 (三) 07:11的最新版本
目的本教程将教大家如何把TSL2561传感器测到的光强度以曲线图的方式在Processing中显示。 设备
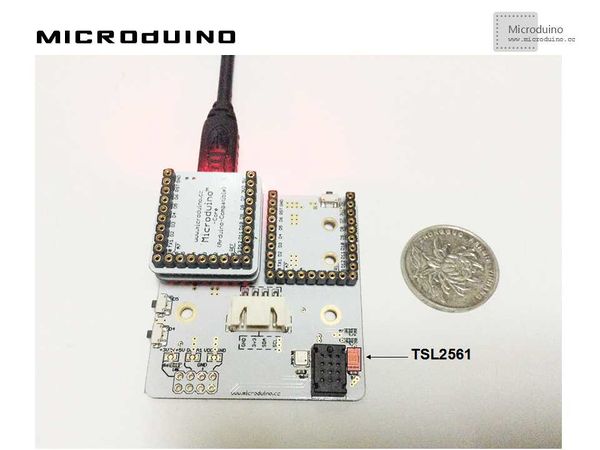
原理图直接使用Microduino-Weatherstation上的TSL2561光照传感器 程序调试步骤一:按着原理图搭建硬件环境,像这样:
本例需要两端的代码,Processing端和Microduino端 Microduino: //得到光照强度数据后输出到串口以便Processing显示 void loop()
{
sensors_event_t event;
tsl.getEvent(&event);
/* Display the results (light is measured in lux) */
if (event.light) {
sensor_lux=event.light;
Serial.println(sensor_lux);
}
delay(100);
}
Processing: //得到第一个串口的数据,并定义如果有换行就缓存 // is always my Arduino, so I open Serial.list()[0].
// Open whatever port is the one you're using.
myPort = new Serial(this, Serial.list()[0], 9600);
myPort.bufferUntil('\n'); // Trigger a SerialEvent on new line
//把从Microduino接收到的数据以曲线图的形式显示在屏幕上,并标上标尺 void draw() {
background(255);
// Draw lines connecting all points
for (int i = 0; i < vals.length-1; i++) {
stroke(0);
strokeWeight(1);
line(i, vals[i], i+1, vals[i+1]);
}
// Slide everything down in the array
for (int i = 0; i < vals.length-1; i++) {
vals[i] = vals[i+1];
}
String val = myPort.readStringUntil('\n');
if (val != null) {
val = trim(val);
println(val);
lux=Float.parseFloat(val);
}
vals[vals.length-1] = 200-lux;
//Display scale
text ( "200-", 370, 10);
text ( "--", 370, 50);
text ( "100-", 370, 100);
text ( "--", 370, 150);
text ( "0-", 370, 200);
//show current num
text ( lux+“ LUX”, 0, 10);
}
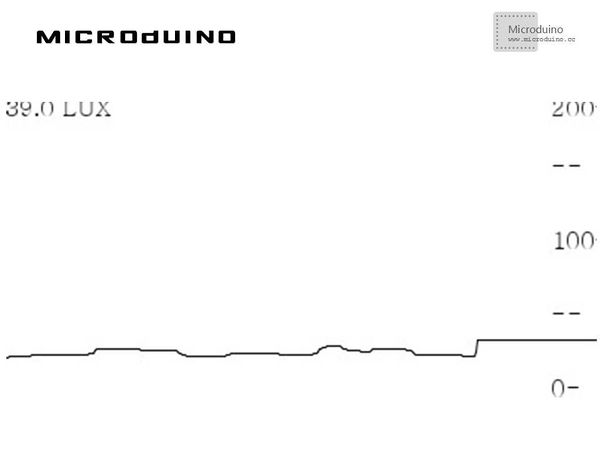
步骤三:下载代码并编译通过。 步骤四:运行后,找个光源在传感器周围晃动,看看能不能显示出光强度数据。 结果屏幕上会显示光强度的曲线图数据,像这样:
视频 |

